Friday, 19 December 2014

The Earth's Energy


by Rob Harris from Oregon State University.

I am interested in understanding the energy budget associated with geologic processes.  I think this understanding leads to better insights into how the Earth works.  For example, plate tectonics – the creation, motion, and destruction of plates – reflects Earth cooling.  About 70% of the Earth’s heat loss is through the ocean floor and is reflected by the cooling and subsidence of oceanic plates as they move away from spreading centers.  The upper layer of these plates, the oceanic crust, is cooled efficiently by hydrothermal circulation.  It turns out that the entire volume of the global ocean circulates through the oceanic crust every few hundred thousand years.  This hydrothermal circulation is important because it leads to significant exchanges in energy, mass, and solutes between the ocean and crust.  These exchanges modify the chemistry of the ocean, the chemical and physical properties oceanic crust, and supports a globally significant biosphere.
 
Rob with his heat probe. Note the thin thermistor string supported by the thick lance.
I am excited about participating on the OSCAR project because it touches on many aspects of these processes, the cooling and evolution of oceanic plates, hydrothermal circulation, and the impact of heat exchange between the ocean and crust.  Specifically, I am using heat flow measurements to better understand how and where fluids are moving in the oceanic crust and how this fluid flow changes as the plate ages.  One mystery is how and why the fluid flow wanes as the plate ages.  Clearly part of the reason is that the plate cools so there is less energy to drive the system, but other processes are involved as well.  This data will also be used to better understand the nature of energy transfer between the crust and oceans.  One idea is that warms fluids emanating from the crust may stimulate the flow of bottom water.
 
The heat probe being deployed, showing the weight stand at the top, and the long lance and thermistor string pointing downwards
The picture shows the heat flow probe I use.  The weight stand contains the data logger, power, and acoustic telemetry so we can monitor its performance from the ship.  These heat flow measurements are made by plunging the probe, under the force of gravity, into sediments.  The lance supports the thermistor string keeping it straight.  We house the thermistor string in a small tube so that the thermal response time is relatively fast, decreasing the time each measurement is made.  This style of probe with a sensitive thermistor string supported by a larger mass is called a violin-bow probe. 

Heat flow is the product of the thermal gradient and thermal conductivity.  Once the probe is in the sediment, we measure the thermal gradient by measuring the temperature at each of the 11 thermistors in the thermistor string and knowing the distance between them.  A heater wire also extends along the thermistor string that generates a short heat pulse.  The way the heat decays lets us determine the thermal conductivity.  These two measurements yield the heat flow.  Low heat flow measurements can indicate areas where cold bottom water enters the oceanic crust.  High heat flow measurements can indicate area where the now warm water exits the oceanic crust.

Tuesday, 16 December 2014

Moorings, landers, and squid


It’s only been a week and a half since we left Panama behind, though we’ve accomplished a lot of science since then. As well as numerous CTD casts mentioned in the previous post, we’ve done almost as many VMP deployments (vertical microstructure profiler) which measure the turbulence in the water column, indicating the extent of water mixing. Additionally, we have deployed 5 semi-permanent moorings, which will measure the hydrography of the ocean for the next few months until collection on a different cruise, 12 MT (magnetotelluric) landers, and started our heat flow measurements. This goes to show that although this is a long cruise (at 6 weeks), time is absolutely of the essence. It’s very lucky to get so many days of sea time to do this research, and we must make the most of it.

Three of the moorings we deployed consist of a set of several instruments, connected in a long vertical array with a weight to keep them anchored to the seafloor. They are supported by buoyancy along the length of the chain, resulting in a floating set of instruments from the seabed to approximately 1500 m above it. These instruments include: 
- micro-CATs, which stands for Conductivity And Temperature (and doesn’t refer to small felines). These are like a smaller version of CTDs and give measurements of the salinity and temperature of the water. 
- Current meters, which measure the strength and direction of the currents throughout the water column. 
- And a bottom pressure recorder, which sits on the seabed at the base of the mooring and measures the pressure every minute, which can tell us about the changes in water depth over time, such as that caused by the tides.

Paul and John attaching an instrument to the mooring rope


The moorings are specially designed for their position to best measure changes in the hydrography of the water column, depending on what is already known about the location. Each length of rope or chain is measured and cut to the specific size long before the ship sails, and then the mooring is put together on deck as it is being deployed, piece by piece. Our first mooring was assembled in an incredibly heavy rain storm, with everyone assisting soaked through within 10 minutes, and staying that way until the last piece went over the side an hour and a half later. Naturally the rain stopped almost as soon as we had finished.

The bottom-pressure recorder and weight going over the side

The last two moorings were ADCP moorings, which stands for Acoustic Doppler Current Profiler. These float 50 m above their anchor on the seafloor and measure the currents in the water column using the Doppler Effect (from movement of particles in the water) to about 500 m above their position. With these, we hope to measure the flow of water into and out of the Panama Basin.

A quick wildlife update
For a few days, we had a blue-footed booby accompanying the Cook on its voyage. Christened Glinda, the bird settled on the aft-deck to oversee the mooring deployments, and obviously pleased with the crew's efforts, flew to the forecastle deck afterwards to sun herself. Glinda has sadly left us now, perhaps to oversee mooring deployments elsewhere.
We were also visited by a squad of squid during one of our CTD casts. They were hunting little whitebait-sized fish that were leaping out of the water, and you could see their tentacles reaching above the surface sometimes to try and grab them. 
Glinda, the blue-footed booby


Tuesday, 9 December 2014

Sampling from the deep


After having left the coast of Panama, we have been steaming into the Panama Basin for the past couple of days. 

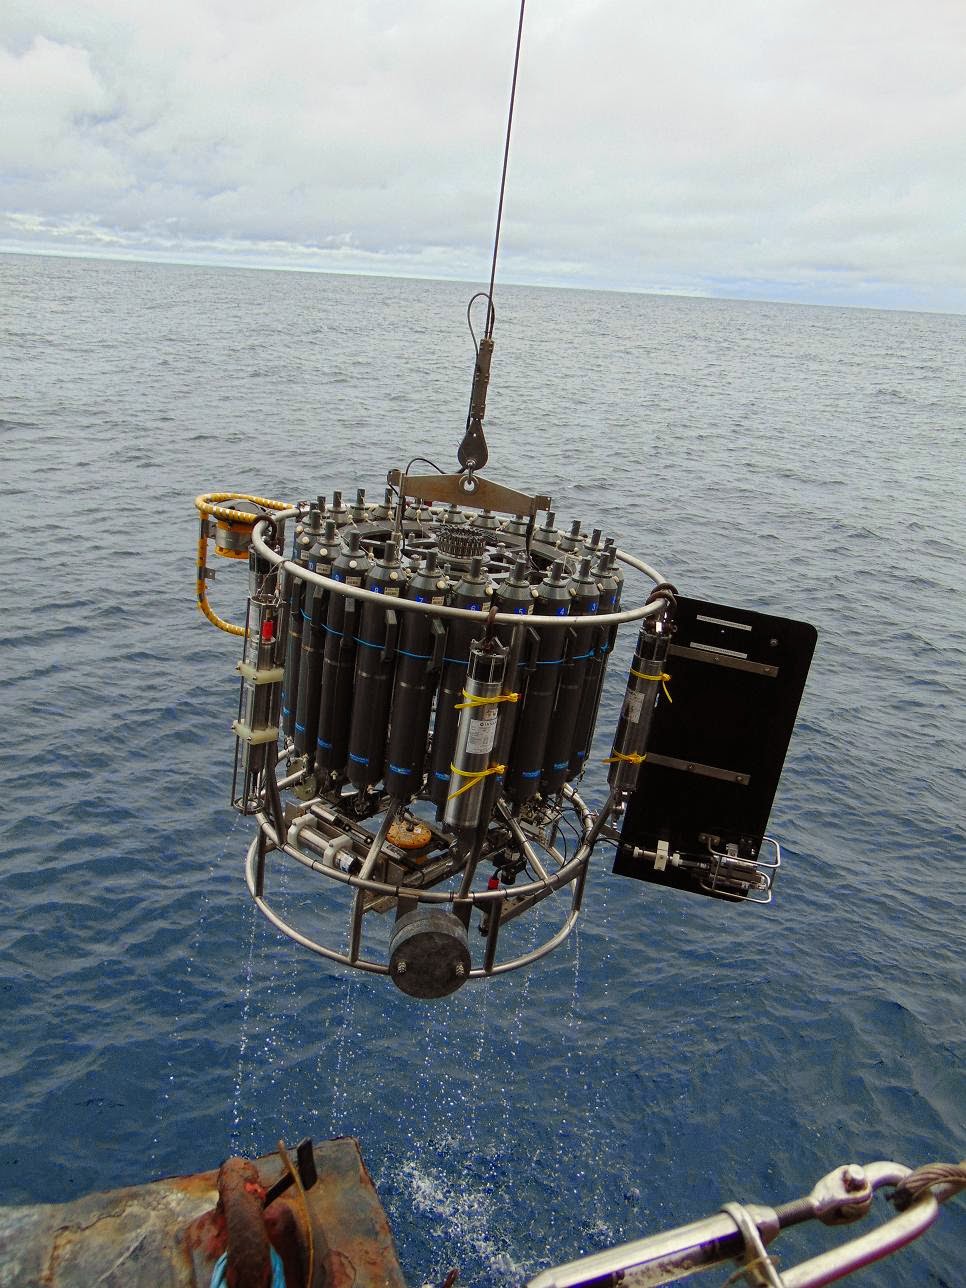
Since then, we have performed four CTD casts! CTD stands for Condutivity-Temperature-Depth, and it is an instrument that measures these properties of the water column (with conductivity giving salinity, and depth coming from pressure measurements). As well as this, a carousel of ‘niskin bottles’ is attached to the instrument, which collects seawater samples from different depths. Other measuring instruments can also be added, including an SVP (sound velocity probe) which measures the speed of sound in the water, and devices which measure the oxygen content and turbidity among other things. All in all it’s a pretty fantastic instrument!

The CTD being lowered over the side. The measuring instruments are attached to the metal frame at the bottom and the side, with the carousel of 24 bottles above (credit: Emma)
The CTD is lowered over the side of the ship using the winch system, right down to within meters of the bottom of the ocean. Once we passed the edge of the continental shelf, this was down to ~3000 m deep, so a lot of cable is needed. The continental shelf is where the ocean-covered continental crust changes into proper oceanic crust, which has a lower elevation due to its higher density. This leads to a relatively steep increase in depth over the shelf. Often, there is increased upwelling of nutrient-rich water at continental shelves, which generally means they’ll be more wildlife around. And sure enough, we did see a few pods of dolphins leaping around the ship, though sadly too far away and quick for good photos.

CTD emerging at the surface (credit: Jowan)
CTD being brought back on deck (credit: Jowan)
Once the CTD is back to the surface, we take water samples from the niskin bottles for analysis of oxygen and salinity content, and sometimes helium content too. More about each of these will come in future posts. It was strange thinking that as we were taking the samples from the first bottles, we were being splashed with cold water (~6 °C) from over 2000 m deep in the ocean, a place none of us will ever go (at least for now!). This contrasted to taking the samples from the last bottle, which contained water from close to the surface of the ocean and was at ~27 °C, warmer than the current air temperature and made us want to go for a swim.
Taking water samples from the niskin bottles (credit: Jowan)

Wednesday, 3 December 2014

A tale of two oceans

Last night we went through the most famous shortcut in the world: the Panama Canal. We arrived in Colon, the port on the Atlantic/Caribbean side yesterday morning, and waited at anchor until our turn to travel through.

16:30 and our journey through the Panama Canal begins, though all we can see is the faint back of the ship in front of us through the rain, fog and thunder. An hour later and we’ve reached the first set of three locks, to raise us up to the level of the large Lake Gatun, entering behind the Baltic Sky. It’s a strange sight to see such a remarkable feat of human engineering surrounded by lush rainforest, with alligators spotted in the water by some. By this point the thunderstorm is fully raging with sheet lightning filling the sky and heavy tropical rain.
Approaching the first lock, with rainforest
on either side (credit: Emma Gregory)
Alligator seen on the bank (credit: Miguel Maqueda)

A few employees of the canal come aboard the ship to throw lines to be attached to the ‘mules’, which are small vehicles on a track that pull the ship through the locks and keep her steady whilst they’re filling with water.
Inside the lock (credit: Emma)
View from the back deck of the lock gates (credit: Emma)

One of the 'mules' steadying the ship (credit: Miguel)
Once we’re through this first set of locks we enter Lake Gatun, which stretches almost to the other side of the thin isthmus. Sadly it’s dark by now, so our only views of the rainforest and islands come with the brief flashes of lightning.

00:00 and we’ve reached the far side of the lake, to the second set of locks which bring us back down to the height of the Pacific Ocean. The surface of the Pacific is actually at a slightly higher elevation than the Atlantic Ocean. This is because the Atlantic generally contains saltier and denser water, so for the same mass of water per area, it occupies less volume. Sea surface height is also affected by spatial differences in the strength of Earth’s gravity, bathymetry (topography of the seafloor), and weather pressure systems among other factors. You can check out https://sealevel.jpl.nasa.gov for some more information.

Map of sea surface height (credit: ESA)
The storm has petered out by now so it’s no longer raining. We reach the end of the locks by ~1:30, and begin our final leg of the transit to dock at Balboa.  


In the next few days, our final mobilisation will take place before the real science begins: taking on water, supplies, and some extra personnel. We will then head off into the Panama Basin in search of our spreading ridge to begin the oceanographic and heat flow measurements this cruise is concentrating on. 

Looking towards the Pacific from our berth in Balboa
(credit: Jowan Barnes)

Thursday, 27 November 2014

What's OSCAR all about?

“The Oceanographic and Seismic Characterisation of heat dissipation and alteration by hydrothermal fluids at an Axial Ridge” a.k.a. OSCAR, is an international project funded by NERC (Natural Environment Research Council) linking both geophysics and oceanography.

Diagram of a segmented spreading ridge, showing
the oceanic crust in black, and upwelling mantle
material (orange/yellow) (credit: NOAA)
We are looking at mid-ocean spreading ridges, where new oceanic crust is formed by upwelling magma cooling at the seafloor. This new crust then moves away from the ridge to allow more to fill in the gap, meaning the further you move away from the ridge, the older the crust will be. Generally there is a relatively high amount of heat flow from the crust into the surrounding ocean at these spreading centres, which can affect ocean temperatures, currents and circulation, which are important to Earth’s climate.


A 'black smoker' (credit: WHOI)
Much of this heat flow is thought to be due to hydrothermal circulation: where seawater percolates down into the crust, is geothermally heated, and then re-emerges into the ocean as hot water containing different elements and minerals picked up from rocks in the crust. These ‘hydrothermal plumes’ are often called ‘black smokers’ due to their dark colour from the minerals they contain. The structure of the crust is thought to affect the pattern of hydrothermal circulation, and vice versa.


During the OSCAR project, we will try and look at how the structure of the crust changes as it ages from a spreading ridge, how this is linked to changes in hydrothermal circulation, and the consequent effects on heat flow and oceanographic processes.

The last corner of Trinidad (credit: Jowan Barnes)

In other news, we set sail from Port of Spain this morning, and are now en route to Panama! We had a beautiful sunny morning to leave Trinidad, sailing past a score of smaller islands, and passing between Trinidad and Venezuela to enter the Caribbean Sea. Dolphins were seen in the distance, and pelicans were skimming the water closer to the ship. Overall, a lovely day, bar some minor sea-sickness and a bit of sunburn!

Pelican seen on quayside (credit: Jowan Barnes)


Tuesday, 25 November 2014

All aboard!

Yesterday, the first group of scientists joined the James Cook research vessel in Port of Spain, Trinidad & Tobago. There are 5 of us currently on board: Dr Miguel Angel Morales Maqueda (Principal Scientist for the first cruise, physical oceanographer from NOCL), Prof Rob Harris (geophysicist and heat-flow expert, from Oregon State University), Jowan Barnes (PhD student at NOCL), Anna Gluder (Masters student from Bangor, and volunteer!), and Emma Gregory (PhD student at Durham University).  We will try and have a blog post focussed on each person mentioned above so everyone gets a chance to introduce themselves and explain what their role is on the cruise. Myself (Emma) and Jowan are first-timers aboard a research ship, so there is plenty to learn- including our way around the ship which can be confusing!
A view of the Cook from the dockside

The Cook is a research vessel owned by NERC (Natural Environment Research Council), whose home port is at the National Oceanography Centre (NOC) in Southampton. The ship is just under 100 m long, with 8 decks with various purposes, though currently we are mainly sticking to the Main Deck (scientists cabins), Upper Deck (labs) and the Mezzanine Deck. The Mezzanine houses the galley and mess, and the other social spaces for both crew and scientists alike: library, lounge and bar, and the TV room. There is also a gym to attempt to keep everyone active during the long weeks at sea. Everyone on board has their own cabin, complete with bed, desk, shelves, wardrobe and sink, and usually shares a bathroom with one other person. I think the cabins are bigger (and nicer) then some university accommodation I’ve seen!
A standard cabin aboard the Cook
At the moment we are still in port, so our general routine is to get up for breakfast, work throughout the day, and sleep at night, though this will probably all change when we are at sea and proper shift patterns are allocated. Main tasks for now are to set up the equipment and computers, and check all is in order for the cruise.


We all can’t wait to set sail!


p.s. The easiest ways to comment on the blog post are to 1) click 'No comments' in the grey bar below the post- the number will change depending on the number of comments, or 2) click on the title of the post and then scroll down to the bottom again. Both of these ways should open a comment box to type into, and will show any previous comments.